With summer behind us and the fall market ahead, it’s worth taking stock of where Greater Boston’s housing markets stand. This year’s YTD analysis (January–August 2025 vs. the same period in 2024) shows a market defined by stability with notable standouts in both condominium and single-family segments. All figures are based on MLS-reported sales. We don’t typically include/report on markets with fewer than 7-8 transactions over this time frame—too much room for error.
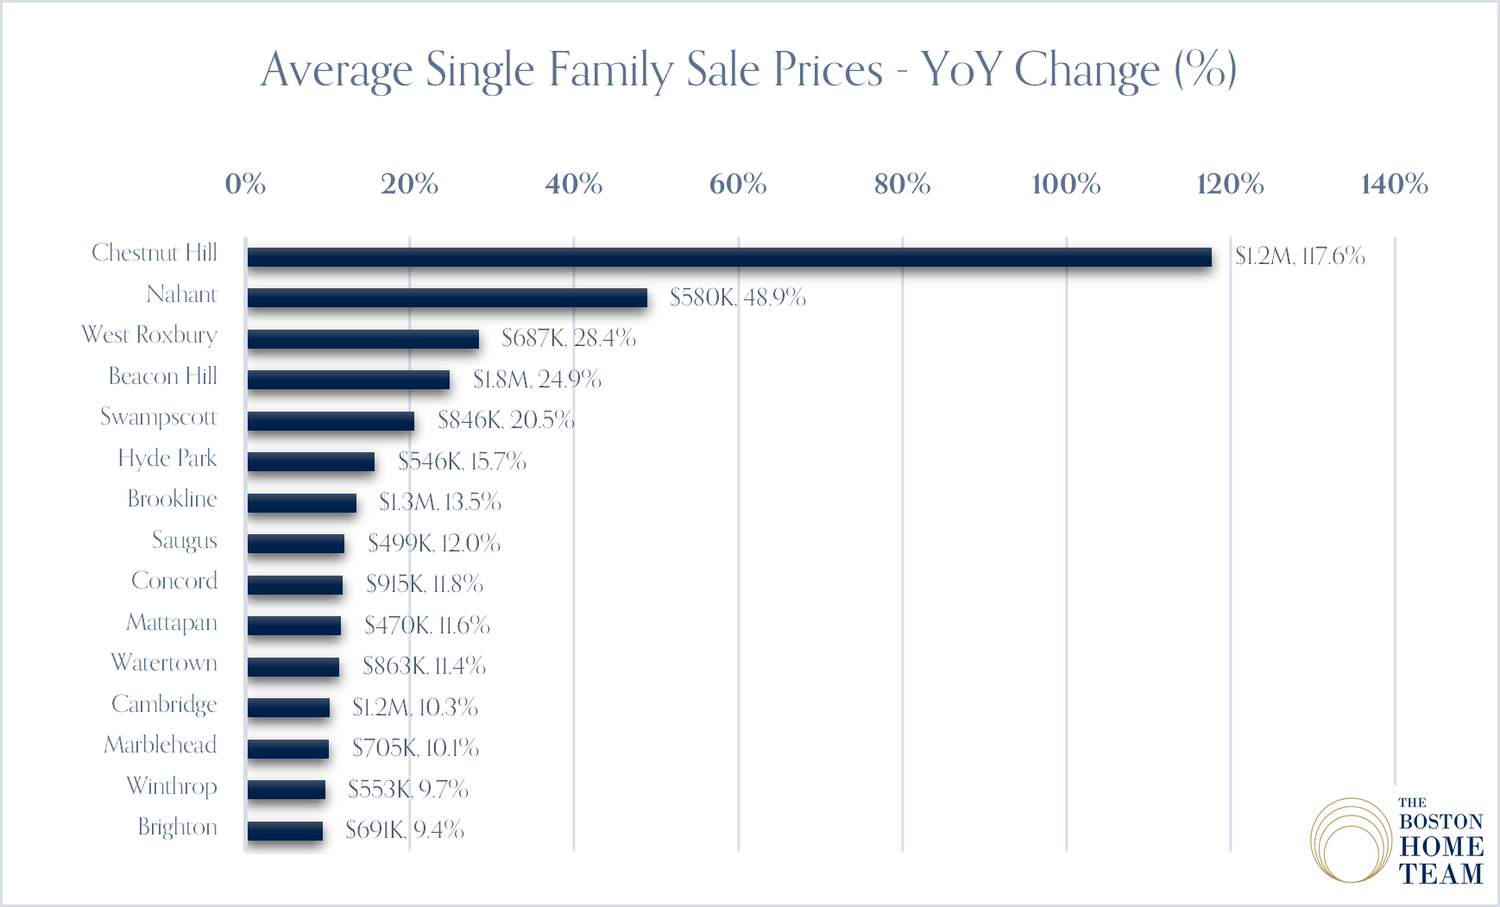
Some of the best year-over-year price jumps in the Greater Boston market.
Overall Trends
Across the Greater Boston footprint, condominium prices rose 5.2% on average, while single-family prices increased 6.8%. Days to offer were essentially unchanged (condos +0.2 days, single-families +0.2 days), and the list-to-sale price ratio slipped modestly (condos –0.4 points, single-families –0.3 points). These averages highlight a market that has held firm, with buyers showing discipline but sellers still achieving close-to-asking results.
Condominium Markets
The condo segment was steady overall but varied significantly by town.
- Chestnut Hill was the most dramatic outlier, with prices up 117.6% year-over-year on 15 sales — a reflection of a small but high-value sample rather than a broad shift.
- Larger markets also posted strong growth: Cambridge (+11.3%, 300 sales) and Somerville (+10.1%, 237 sales) both delivered double-digit gains, underscoring buyer demand for urban living.
- Newton (+9.6%, 208 sales) and Medford (+9.3%, 166 sales) rounded out the top five, each showing meaningful appreciation backed by solid sales counts.
On the other end of the spectrum, SALE PRICES:
- Beverly fell –15.4% (69 sales),
- Dedham declined –9.3% (39 sales),
- Revere dropped –8.7% (90 sales), and
- Chelsea softened –6.9% (69 sales).
These markets underscore that while condo prices rose overall, not every area participated equally.
Single-Family Markets
Single-family homes posted broadly based gains. Measured by price growth, list-to-sale price ratio, and days to offer, highlighted towns where strength was consistent across multiple dimensions.
Leading examples include:
- Cambridge (+15.2%, 127 sales), where strong demand pushed values significantly higher.
- Somerville (+13.5%, 116 sales) and Newton (+12.9%, 320 sales) also ranked high, both combining price growth with healthy sales activity.
- Brookline (+10.7%, 132 sales) and Arlington (+9.8%, 154 sales) filled out the top group.
Taken together, these towns demonstrate the continued resilience of single-family housing in Greater Boston, particularly in established urban and near-suburban markets. And while Somerville’s inclusion on this list may be a little surprising, Cambridge and Brookline, aside from lot sizes, are so remarkably similar in price, volume, and market velocity.
Markets That Held Their Ground
Several towns held remarkably steady, posting YoY price changes within ±2%. This “held-their-ground” group included a mix of both condo and single-family markets, reinforcing the broader theme of stability. Examples include West Roxbury condos (–1.1%, 92 sales) and Malden single-families (+1.3%, 148 sales). For buyers and sellers alike, these towns represent balanced markets without sharp shifts.
Awards! Best Overall Performers
- Best Condominium Market (≥8 sales): Chestnut Hill — prices surged 117.6% on a small but notable 15 sales, making it the statistical outlier of 2025 so far. Among larger markets, Cambridge (+11.3%, 300 sales) stands out for both size and strength.
- Best Single-Family Market (≥8 sales): Cambridge — values rose 15.2% on 127 sales, with Somerville and Newton not far behind.
Takeaway
The first eight months of 2025 confirmed what many suspected: Greater Boston’s real estate market is holding its ground. Condos delivered modest gains overall with pockets of standout performance, while single-families continued their steady climb. A handful of towns saw sharp swings — both up and down — but most clustered within a narrow ±2% range.
Heading into fall, the story is one of balance: selective strength in urban hubs, steadiness in many suburbs, and no signs of broad weakness. Obviously, the interest rates, the nation’s overall economic health (which is still a large question mark), and the job market will be major factors in the months ahead. And housing inventory, climbing slowly but still at historic lows, will be a significant factor too.
Appendix: Ranked Lists
Top 5 Condo Markets by Price Growth (≥8 sales)
1. Chestnut Hill (+117.6%, 15 sales)
2. Cambridge (+11.3%, 300 sales)
3. Somerville (+10.1%, 237 sales)
4. Newton (+9.6%, 208 sales)
5. Medford (+9.3%, 166 sales)
Bottom 4 Condo Markets by Price Change (≥8 sales)
-
Beverly (–15.4%, 69 sales)
-
Dedham (–9.3%, 39 sales)
-
Revere (–8.7%, 90 sales)
-
Chelsea (–6.9%, 69 sales)
Most Robust Single-Family Markets (Composite, ≥8 sales)
-
Cambridge (+15.2%, 127 sales)
-
Somerville (+13.5%, 116 sales) - Newton (+12.9%, 320 sales)
-
Brookline (+10.7%, 132 sales) - Arlington (+9.8%, 154 sales)