

Greater Boston Real Estate Market Spotlight – Q3 2025
The Greater Boston housing market in Q3 2025 tells two stories: luxury towns and urban cores continued to set record prices, while mid-tier suburbs gained momentum with faster-moving demand and competitive bidding. With Q4 ahead, historical data from late 2024 points toward a familiar seasonal slowdown.
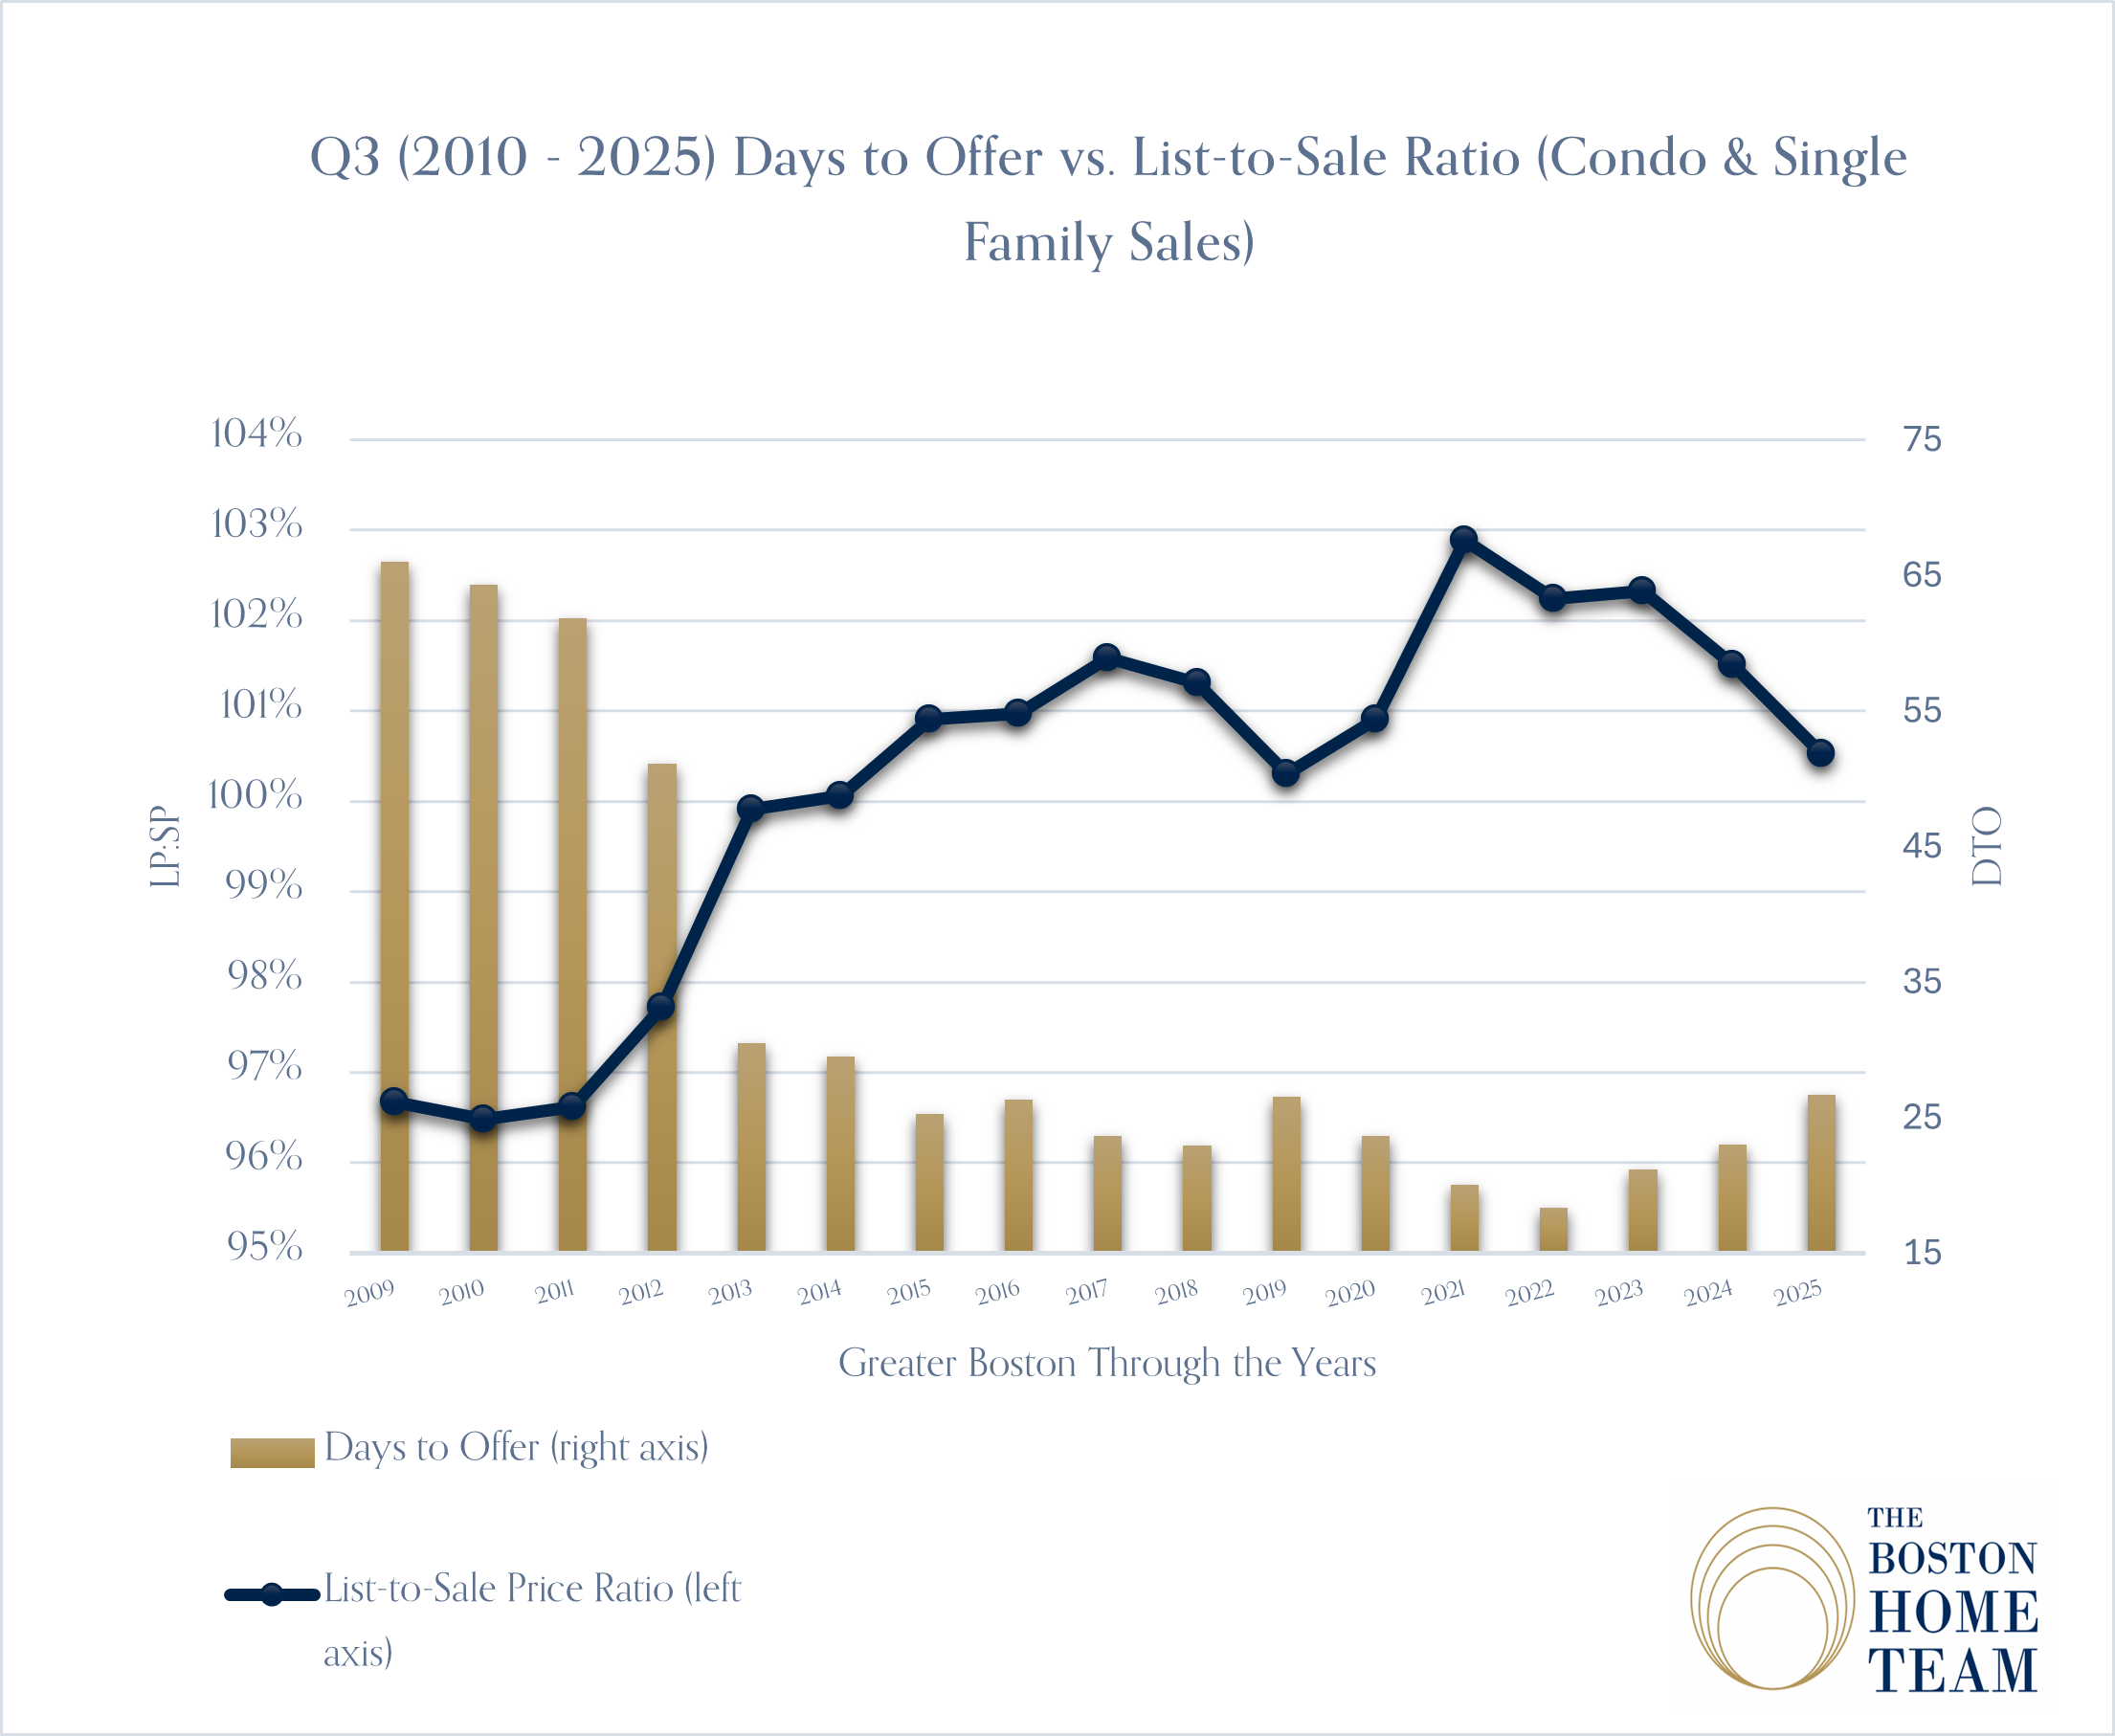
A look at Q3, year over year, in Greater Boston generally since 2010. The trends suggest a softening ahead.

Sales volume in Q3 has been steady these past 3 years while average prices continue to climb. This graph represents single families and condos.
Luxury Still Leads the Way
On the high end, Brookline ($2.85M), Cambridge ($2.69M), Wellesley ($2.68M), Newton ($2.14M), and Belmont ($2.12M) posted the highest average single-family prices this quarter. These markets remain the pillars of Greater Boston luxury, with strong sales volume supporting their averages.
For condominiums, it was all about the urban core: Back Bay ($1,446/sqft), Beacon Hill ($1,282/sqft), and the South End ($1,142/sqft) dominated the price-per-square-foot leaderboard, reflecting the continued premium on Boston’s historic neighborhoods.
Fast-Moving Suburban Markets
While luxury markets continue to anchor the high end, the strongest competition this quarter showed up in more affordable suburbs:
Homes in Malden (10 days), Arlington (12), Melrose (13), Everett (13), and Peabody (13) sold in under two weeks on average.
In terms of bidding pressure, Melrose (107% of list), Arlington (106%), Lexington condos (104%), Malden (104%), and Cambridge single families (104%) stood out.
Melrose and Arlington are the clear hot spots of the quarter, appearing in both the speed and over-ask categories.
Growth Stories
The strongest growth momentum did not come from the luxury tier but from emerging neighborhoods. Everett stood out as the only community to lead in both condominium and single-family growth. Charlestown (single families), Winchester (condos), and Hyde Park (single families) also posted notable gains.
These patterns highlight how buyers are seeking relative value just outside the core, creating competitive conditions in areas that were once considered secondary markets.
Volume Leaders
Several neighborhoods continue to set the tone through sheer market size:
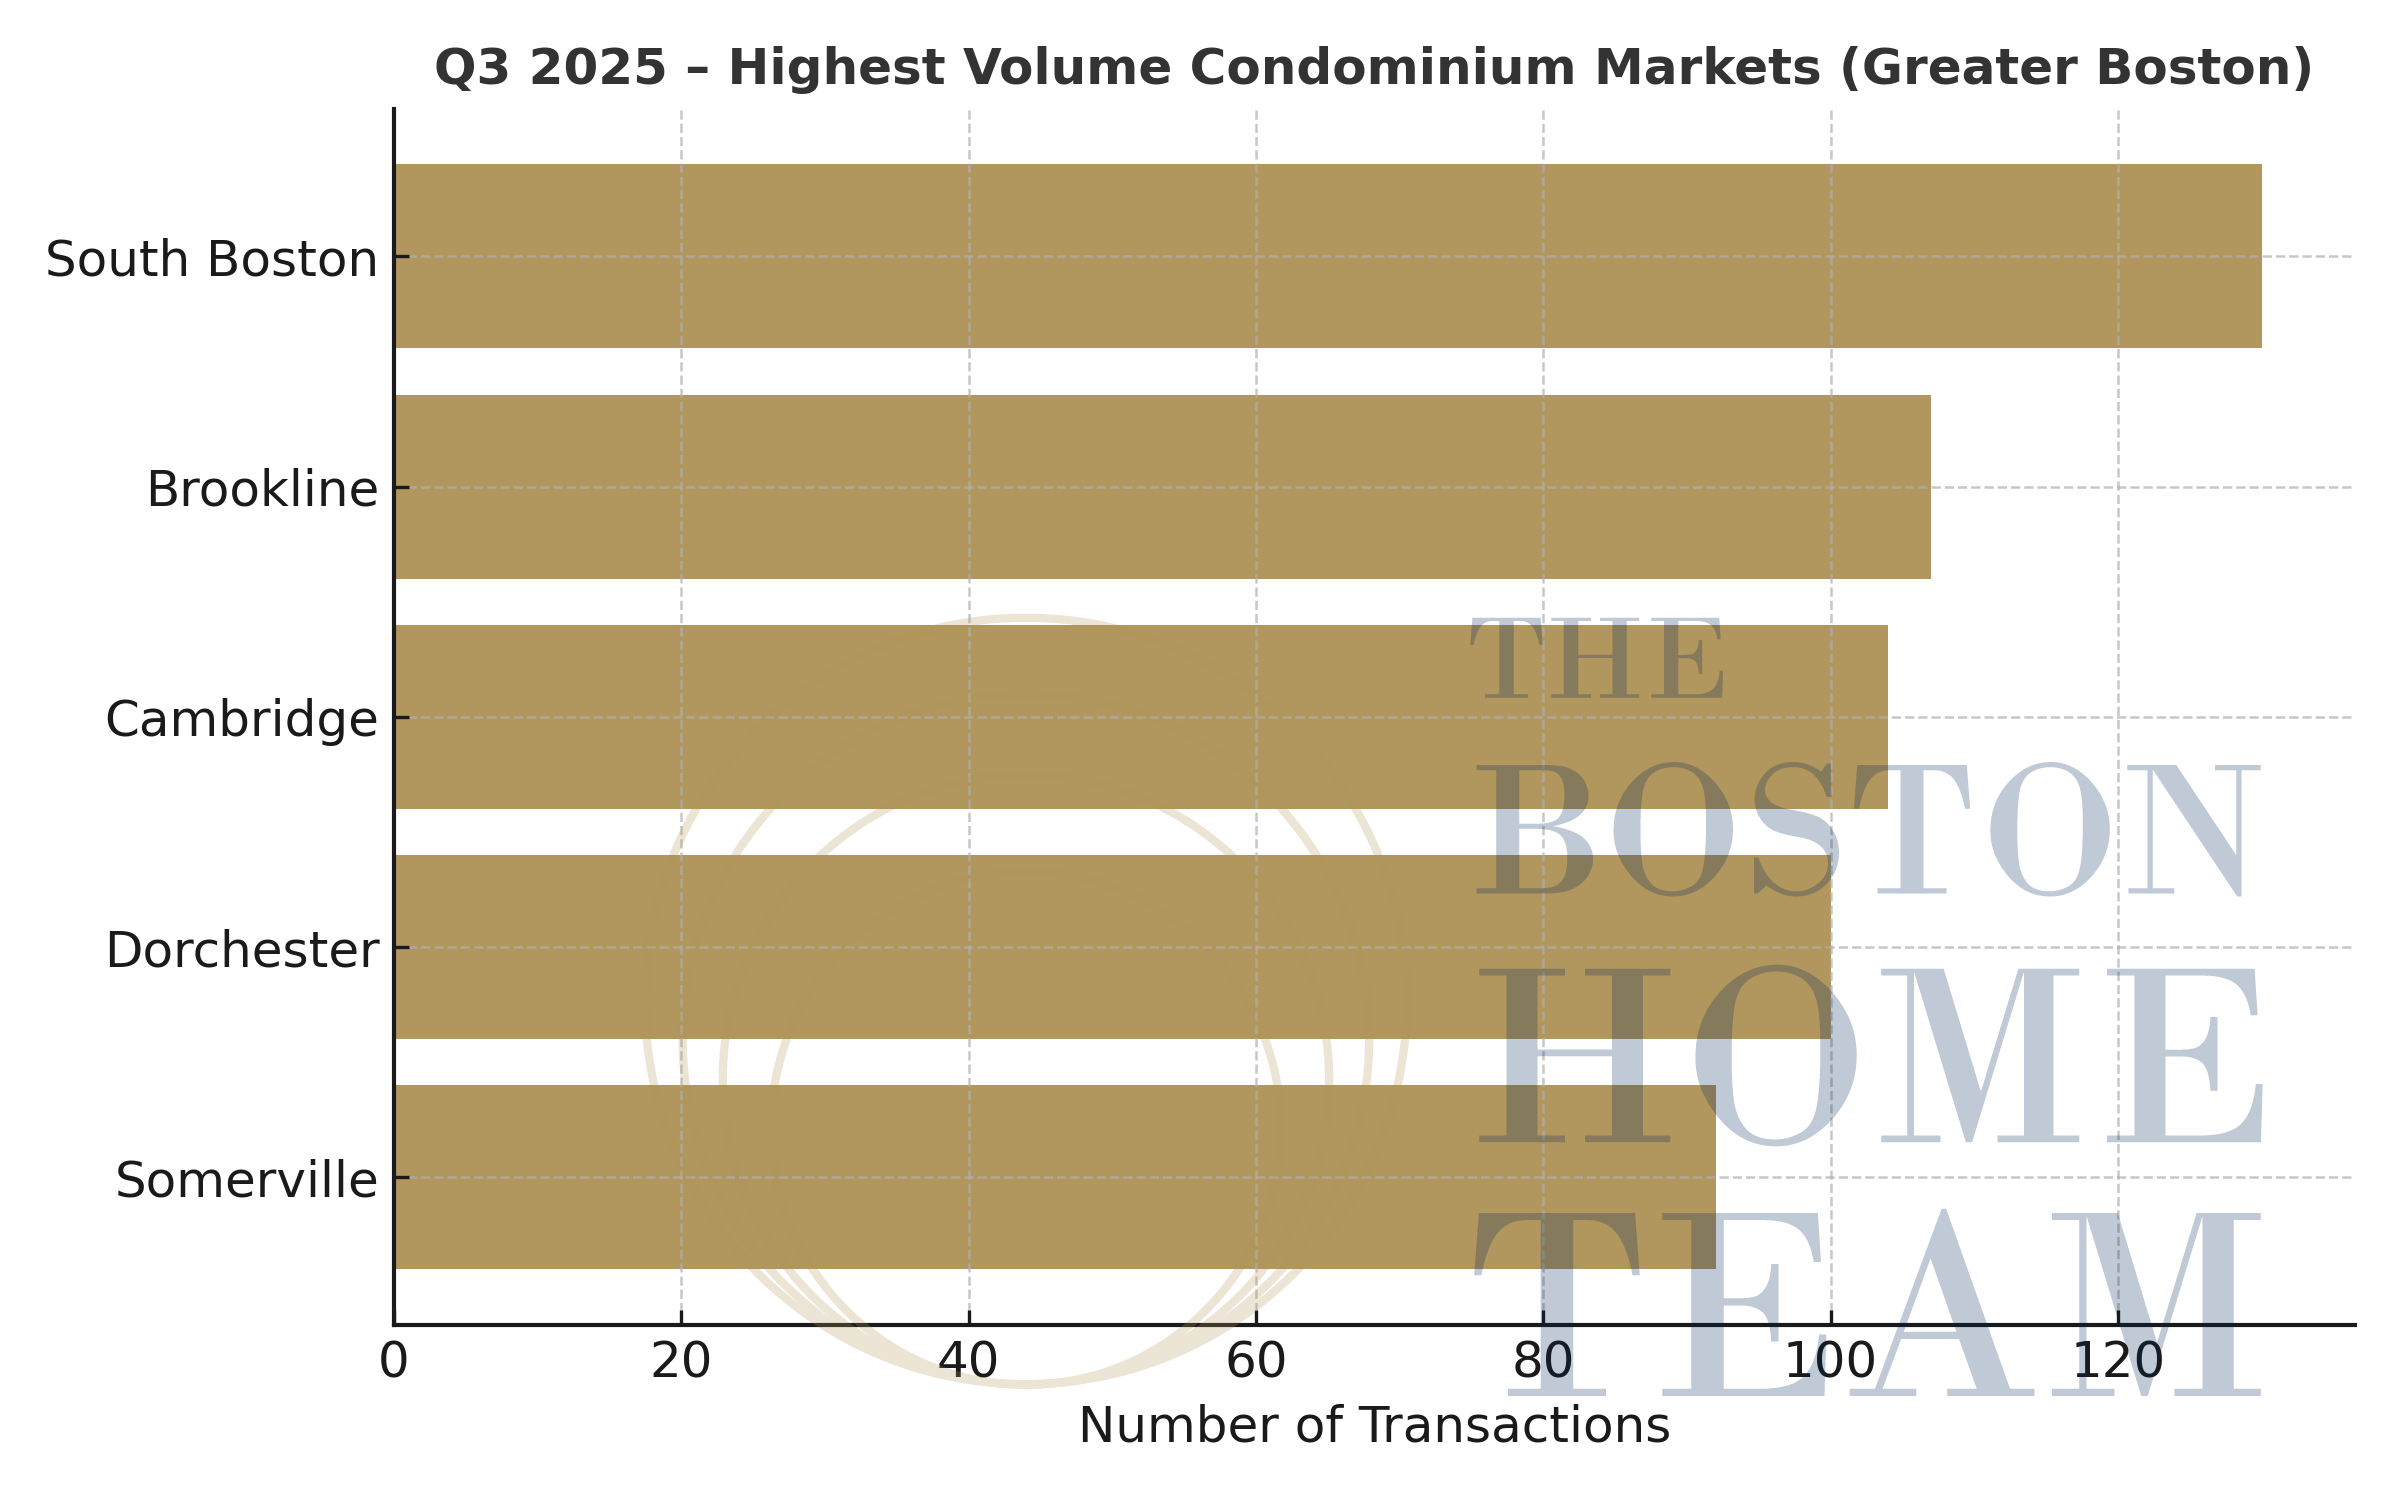
South Boston Condos (130 sales)
Newton Single Families (129)
Brookline Condos (107)
Cambridge Condos (104)
Dorchester Condos (100)
High-volume markets such as South Boston, Newton, Brookline, and Cambridge are key drivers of overall market sentiment.
Looking Ahead: What Q4 Might Bring
Last year’s seasonal data offers a useful guide. In Q4 2024, Greater Boston saw:
Median Sale Price: -0.4% vs Q3
Price per Square Foot: -0.5%
Days to Offer: +24% longer
Sale-to-List Ratios: -1.1%
This translated into modest price pullbacks, longer selling times, and fewer bidding wars as the market cooled into winter.
If patterns repeat, Q4 2025 is likely to follow a similar trajectory: slightly lower prices and price per square foot, longer days to offer, and softer sale-to-list ratios. Luxury towns such as Brookline, Newton, and Cambridge may prove more resilient, while high-volume condo markets like South Boston and Dorchester are more likely to reflect the seasonal slowdown.
Key Takeaways
Q3 2025 was a quarter of luxury resilience and competitive suburban markets, with Everett and Hyde Park emerging as growth stories and South Boston Condos and Newton Single Families leading in volume. Looking ahead, the data suggests a more measured Q4 as seasonal factors take hold, just as they did in late 2024.
*All data was imported from MLS, calculations made by The Boston Home Team